
Which sectors drove the Nifty higher and where are we headed with the current correction?
Which sectors drove the Nifty higher and where are we headed with the current correction?

Nifty
The chart below shows the nifty index and we can see that the index has corrected significantly from the highs and the nearest supports are placed at the 14,700 levels.

The index despite making the new all time highs saw participation from the IT stocks weaken. The IT stocks have not really participated in the current rally and that is evident from the charts below where we see that the IT index has not made new highs whereas the Nifty has.

The chart above shows the IT index not make a new high along with the broader Nifty Index.
The banking sector has been the main driver of the rally and it has been driven mainly by the PSU Banks. The below charts are going to depict that .

As we can see from the above chart we have the ratio chart of Banknifty to Nifty making new highs which shows that the Banking sector had been outperforming the nifty. The interesting thing is to note which components of the sector were doing well.
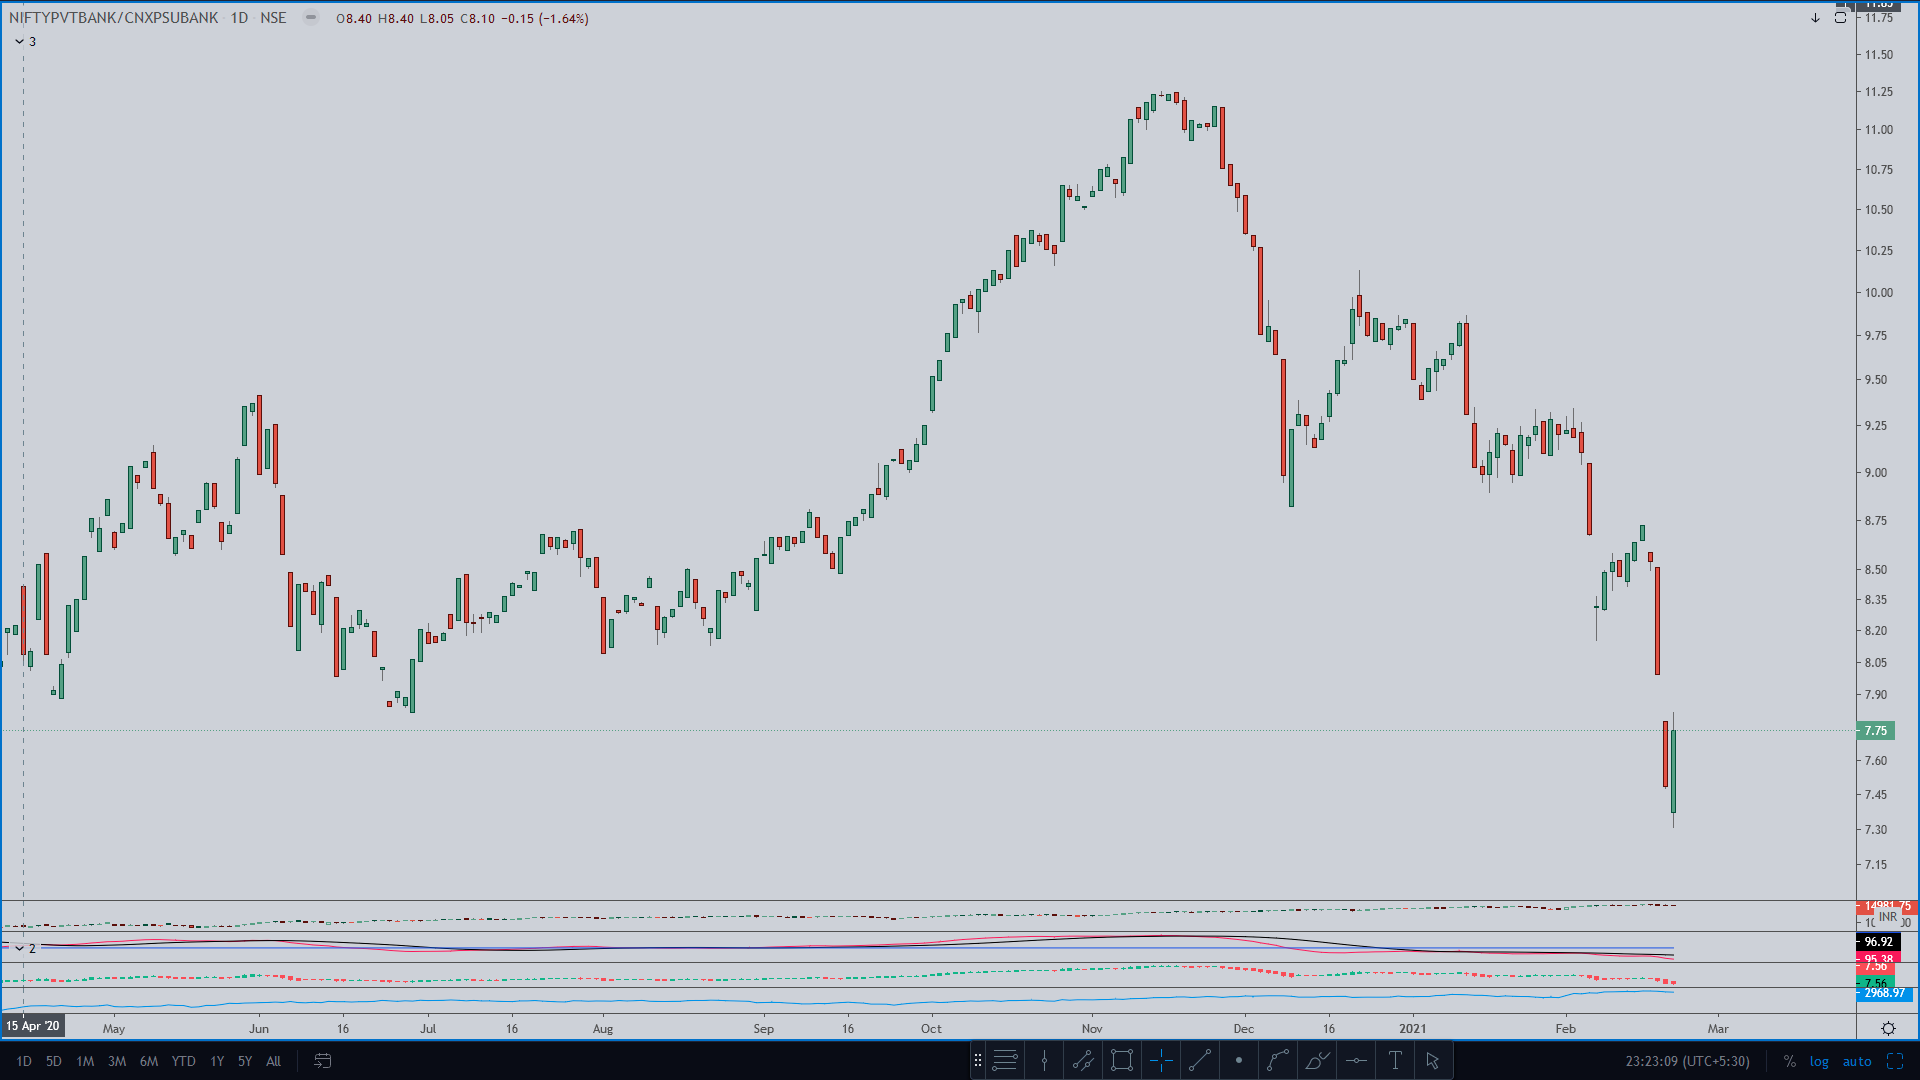
The above is the ratio chart of the Private bank versus the Public sector banks. The chart shows how the private sector banks have under-performed the public sector bank. In other words the current rally in the banknifty has been driven primarily by the public sector banks. What we will also see is the fact that the public sector companies are also responsible for the big rally in the Nifty.

The above is the chart of the Public Sector Enterprises index which has been making new highs and as we can see that it had been rallying strongly till the Friday closing when the market started to correct. This has a strong impact on what the market could be doing in the coming few sessions. As the leader of the rally in this leg if we see the weakness set in this sector the going for Nifty could get even tougher in the next few sessions unless some other sectors were to come up to support the broader market.
Gas Stocks
Another story of the last coupe of weeks have been the gas stocks which have been rallying non-stop and both from the public sector as well as the private sector.
Several stocks like the IGL and the Gujarat Gas have gone on to make new all time highs, whereas the others like GAIL etc have also rallied sharply. The stocks though are starting to look overbought in the short term. The overbought nature of the momentum could mean that the stocks end up going into the sideways consolidation for some time but they have definitely broken out of long term consolidations and we will perhaps see much higher levels in them over the next 12 months or so.

The basket of the 4 gas stocks making new all time highs which are also seen breaking out from the long term consolidation.

The above chart on the monthly time-frame makes it a little more clear. What we see is the sideways movement for the long time and now we are seeing the candle breakout from the rectangle that had been formed over the past 3 years.
This is the chart for the basket, and it shows that the gas sector as a whole has started a new bull market which will probably carry on for a while. Any pullback in the basket will be a good chance to add the stocks to ones portfolio.
In this newsletter we have tried to cover the major story of this rally the leaders and the laggards and the sectors which we think could perform well over the longer term in the future. There is a lot more that has happened in the financial markets over the last few weeks and it warrants a greater discussion than a sub-heading in the newsletter. We will be writing about that in the near future so stay tuned and do not forget to subscribe and share the newsletter with your friends if you found this useful.