
The end of the bull market in the midcaps and the small caps?
The end of the bull market in the midcaps and the small caps?

Over the last few trading sessions many investors are familiar with the falling portfolio valuations whereas the headline index has been making all time highs. This must feel like deja-vu to a lot of the investors who suffered something similar after the 2018 top in the mid and the small cap category when the headline index itself had been making all time highs but the portfolios of most of the investors continued to fall. The broader markets were firmly in the grip of bear market and there was no denying that, infact that was the time when several of the portfolio managers had suffered the ignominy of the index far outperforming their respective portfolios. In fact in some cases the managers had returned a negative return when the headline index had itself been making new all time highs much to the chagrin of their clients. If one looked closely at the portfolios of these managers it was not rocket science as to why they had performed so poorly. Many of them had a portfolio which was rather too heavy on the allocation to the mid and the small caps, and hence when they did not do too well the performance of the managers also took a beating. At the same time the rally in the nifty was very narrow, in fact if one saw the equal weighted nifty index that had also been underperforming the headline index. In other words the market had been taken to new highs due to a handful of the stocks and by the virtue of them having a higher weightage in the index, the index itself kept making new highs. The prolonged period for which this continued baffled a lot of investors and also led to a redemption in several of the mutual fund schemes which had returned negative returns after almost two years.
The scenario now
The last few days have certainly set the alarm bells ringing as far as the investor are concerned on the back of what looks like a 2018 redux. A very sharp rally in the mid and the small caps which had an abrupt ending while the headline index made new highs leaving the investors second guessing as to whether the bear market had really arrived or not. If one looks at the charts at the moment then certainly, they point to what can be a correction in the small and the mid caps but, they do not yet point to an all out bear market. An example is the chart below, which is showing the RSI which is a momentum oscillator in the overbought territory and now falling which is an example of the momentum in the mid and the small caps now ending. Which while it may be concerning is not the only thing that we notice. We are also seeing a very negative picture on the charts of the mid and the small caps on the weekly time frame which is not a very good sign. While this does not mean that the bear market has started it definitely means that the rally for now is over and we could soon see correction in the coming few days which can be pretty sharp given the circumstances where a majority of the stocks are overheated and are perhaps ripe for a correction.

What about the global markets?
The global markets at this juncture are not looking too good either with the french index also showing overbought reading and the US markets showing a few divergences and all this on the weekly charts. This does not look good especially from the point of view of the global risk appetite itself. It looks as though the risk capital is exhausted and there is certainly a chance that in the near future, where we have the scenario that markets are overall weak or correcting. The russell 2000 in the US has been struggling for a while now and the other indices could well start falling too.

The charts of the french index are also attached below for reference and it looks like they are now catching a breath after having a stellar rally.
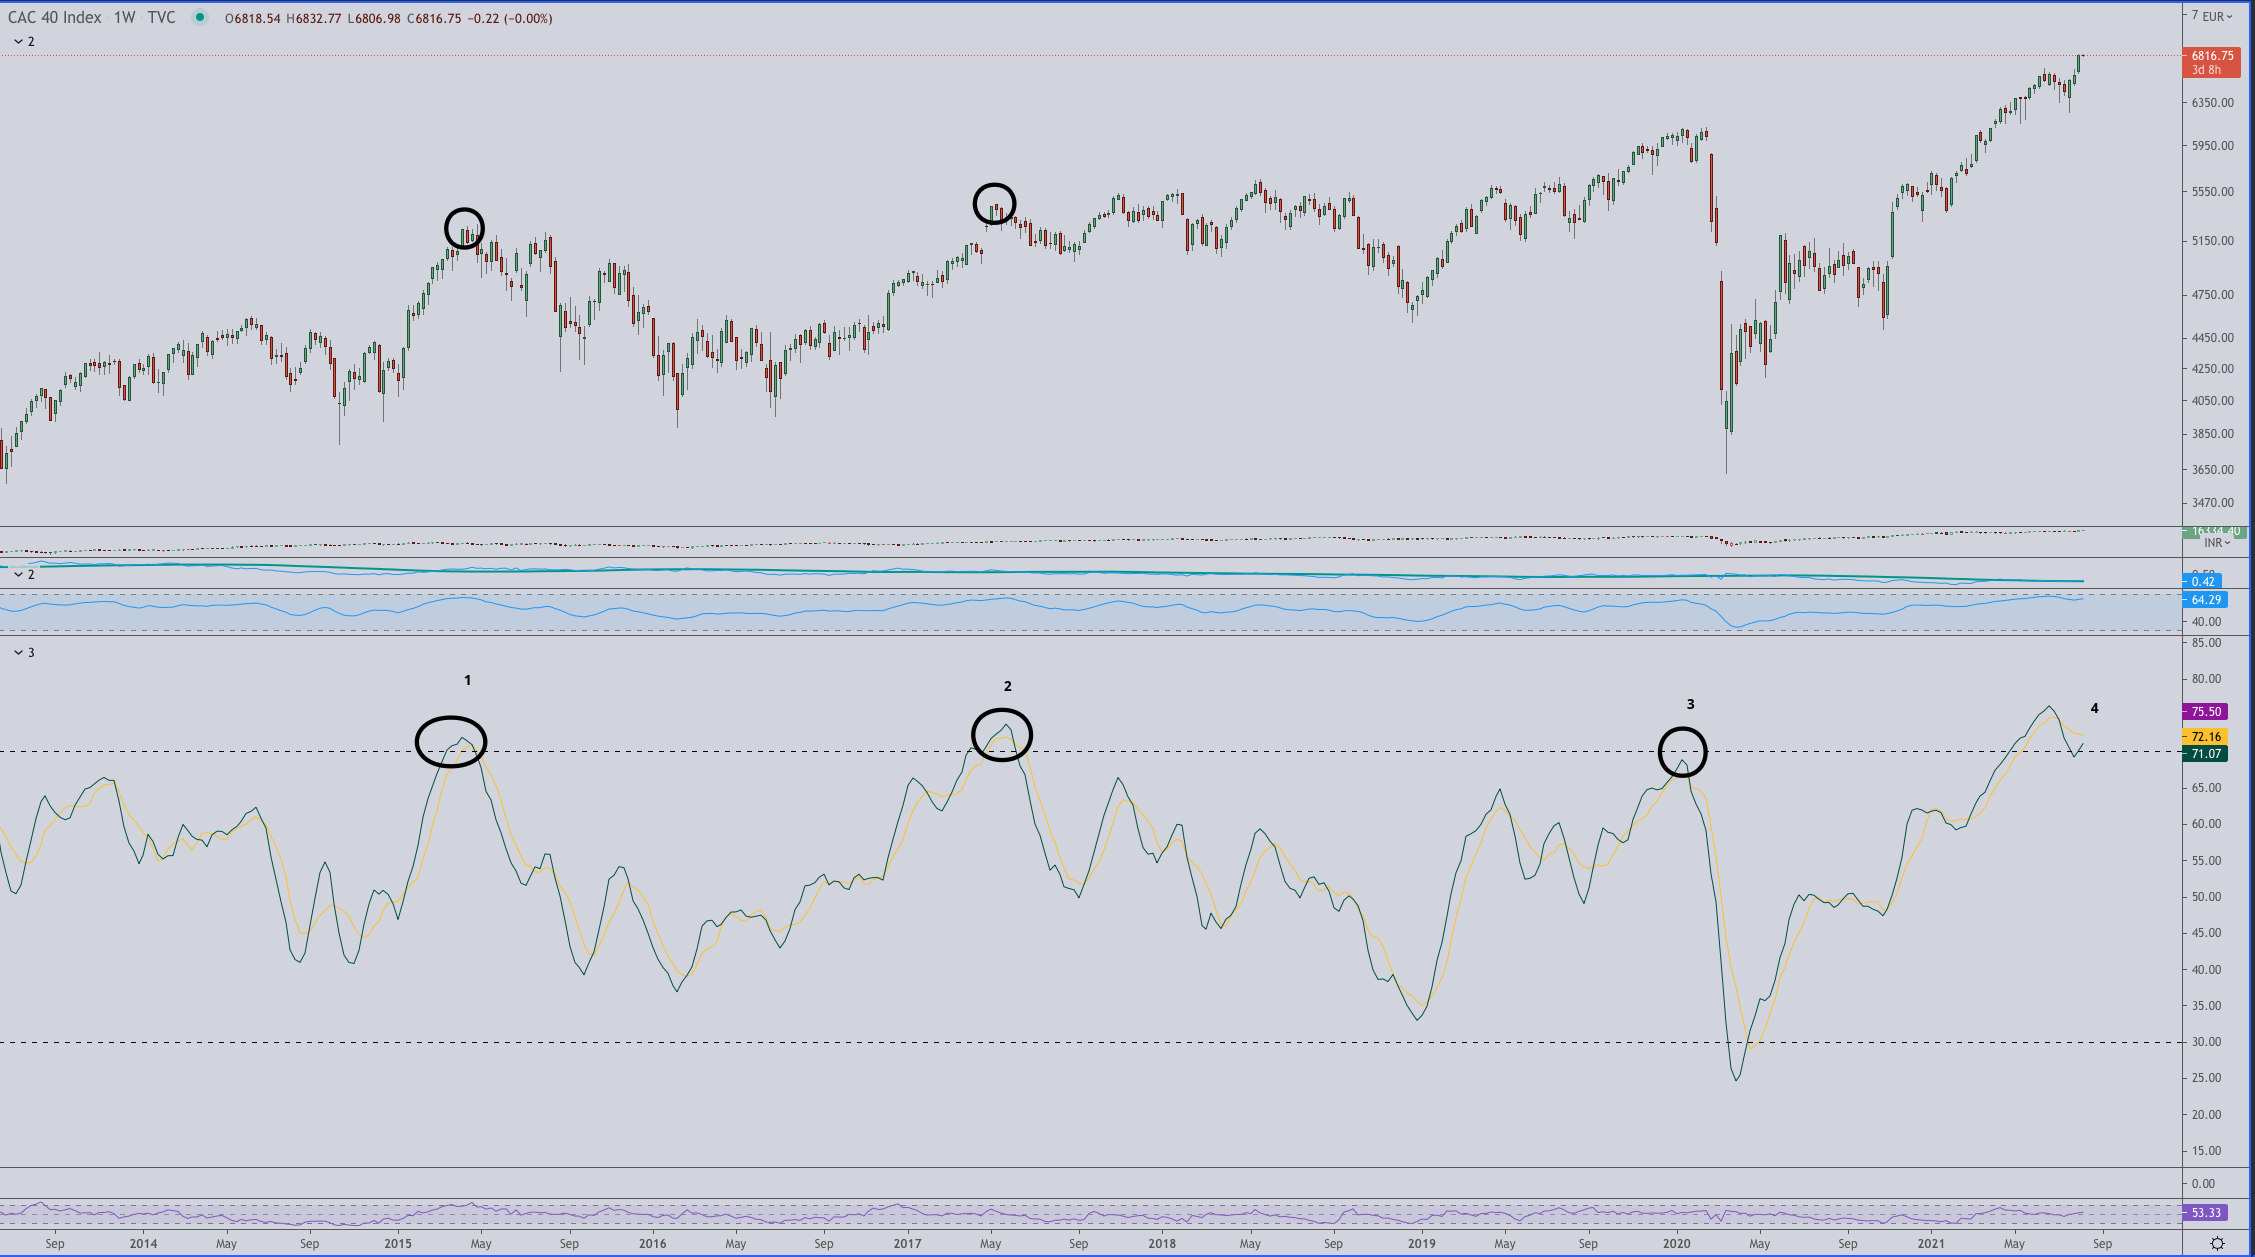
One can see in the above chart that after the momentum oscillator reached the overbought levels we had the market either correcting or consolidating for a considerable period of time after that. These are marked by 1, 2 and 3. The number 4 is the current reading and we are waiting to see what we get this time. But it is definitely clear the risk reward to making commitment is not favourable at the moment. That could mean that the current flows in the equity market are halted and they could lead to the market consolidating for a while.
The commodity markets are also looking pretty interesting if one looks at the charts of copper and oil. The oil it looks like has made a short term top while the copper is putting in place what looks like a head and shoulders top which is again being observed on the weekly charts. If that were true and the copper being traditionally a harbinger of the economic activity this definitely does not look good.

On the other side we have the oil which is looking like it is already made a top and is now looking at either consolidating or lower levels. This also does not augur well for the equity markets generally as the oil prices if they keep falling is not a good sign. What we need is a stable oil price or rising slowly, if we keep seeing it fall then that is generally not a good sign.
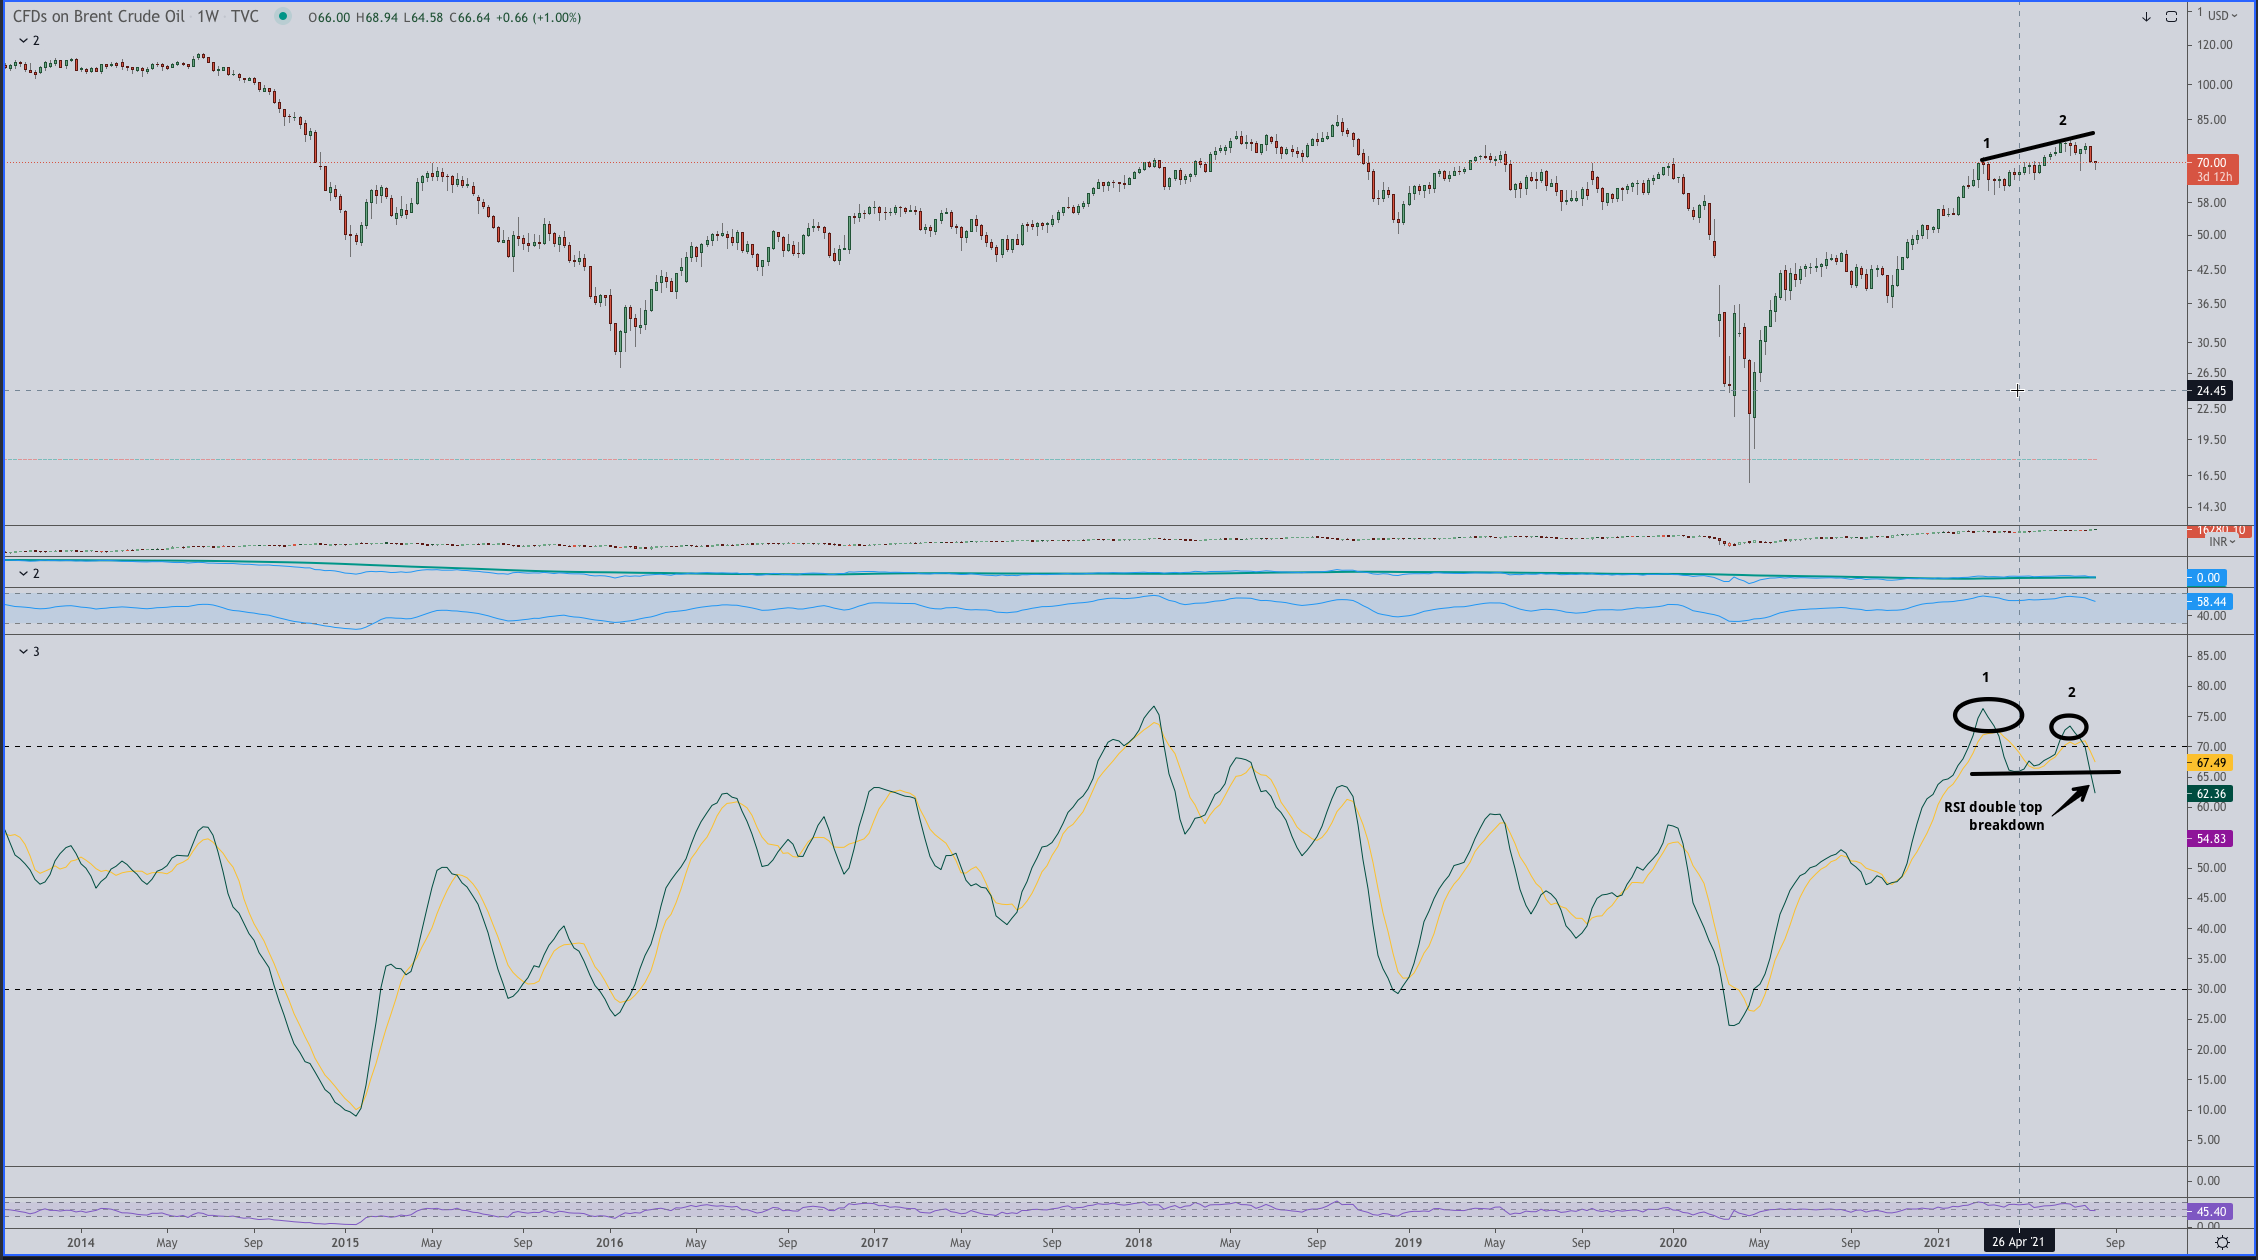
The chart above is the oil on the weekly timeframe which is again looking very overbought. The numbers 1 and 2 denote the high in the momentum indicator which is the RSI and and the price. As we can see the price has made a higher high whereas the momentum has made a lower high, this is known as the bearish divergence and generally is a bearish sign. Confirming the bearish grip is also the RSI breakdown from the line which is shown in the chart as the double top breakdown. The prices have also gone lower after that suggestion that the top is indeed in place for the near term.
Final thoughts
The above data makes it clear that the markets are now looking to take a breather after a massive rally. The charts definitely point to a halt in the rally and while they do not point to a bear market it is wise to be a little careful before one commits to this market especially if the time horizon is short. Also important is to remember that even if the bear market is not confirmed the portfolio can fall quite sharply and hence caution is warranted. It will be good to remember that the 2018 top in the mid and the small caps took almost three years to be taken out. That is a very long time for some and it happened after the portfolios at one point had fallen more than 50% in several cases. In fact several mutual funds were showing losses of more than 50% at one point in time from their peak valuation.
Hope you found this newsletter worth reading and if you did do try subscribing or sharing this !